Saw iNaturalist data in the wild
Pun intended... but while I was out in downtown LA visiting Olvera Street yesterday, I also got to see some iNaturalist data being used in public science education.
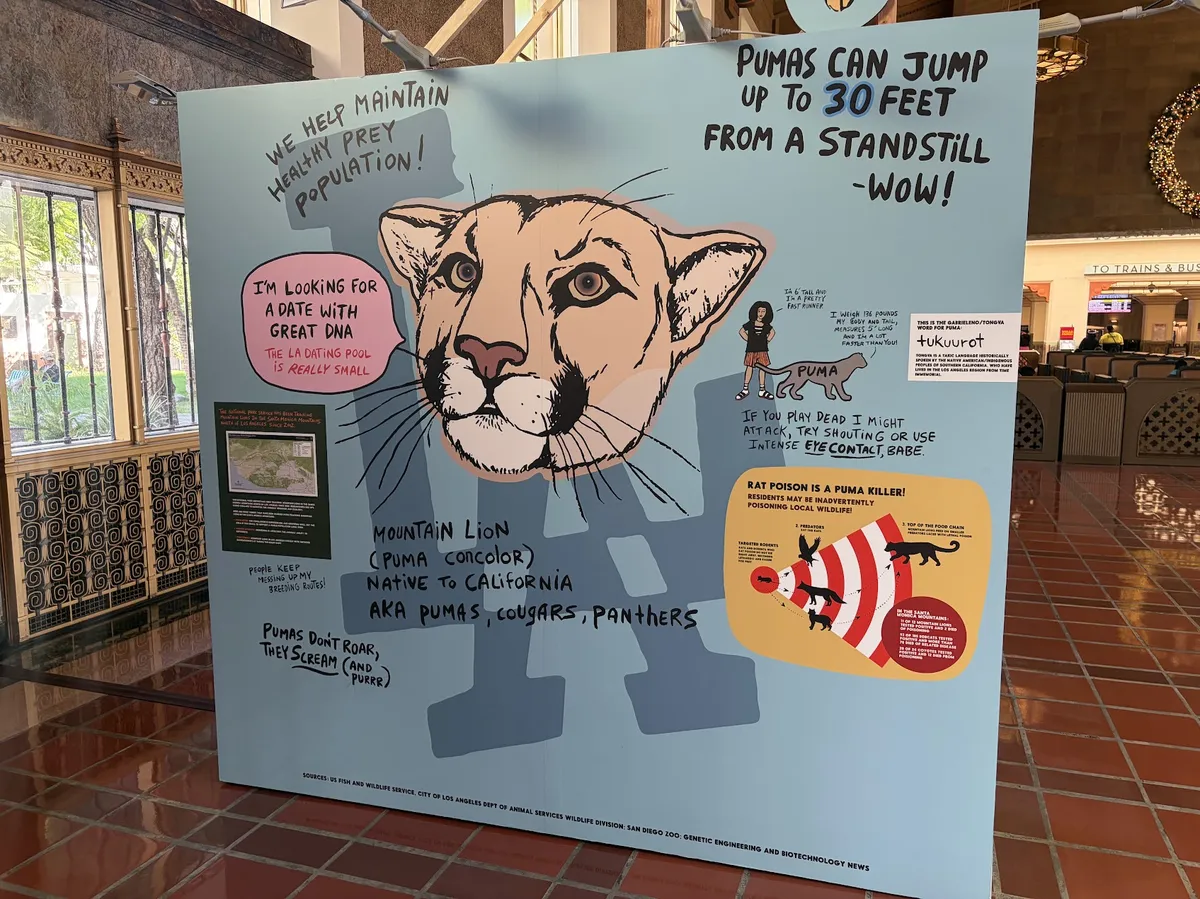
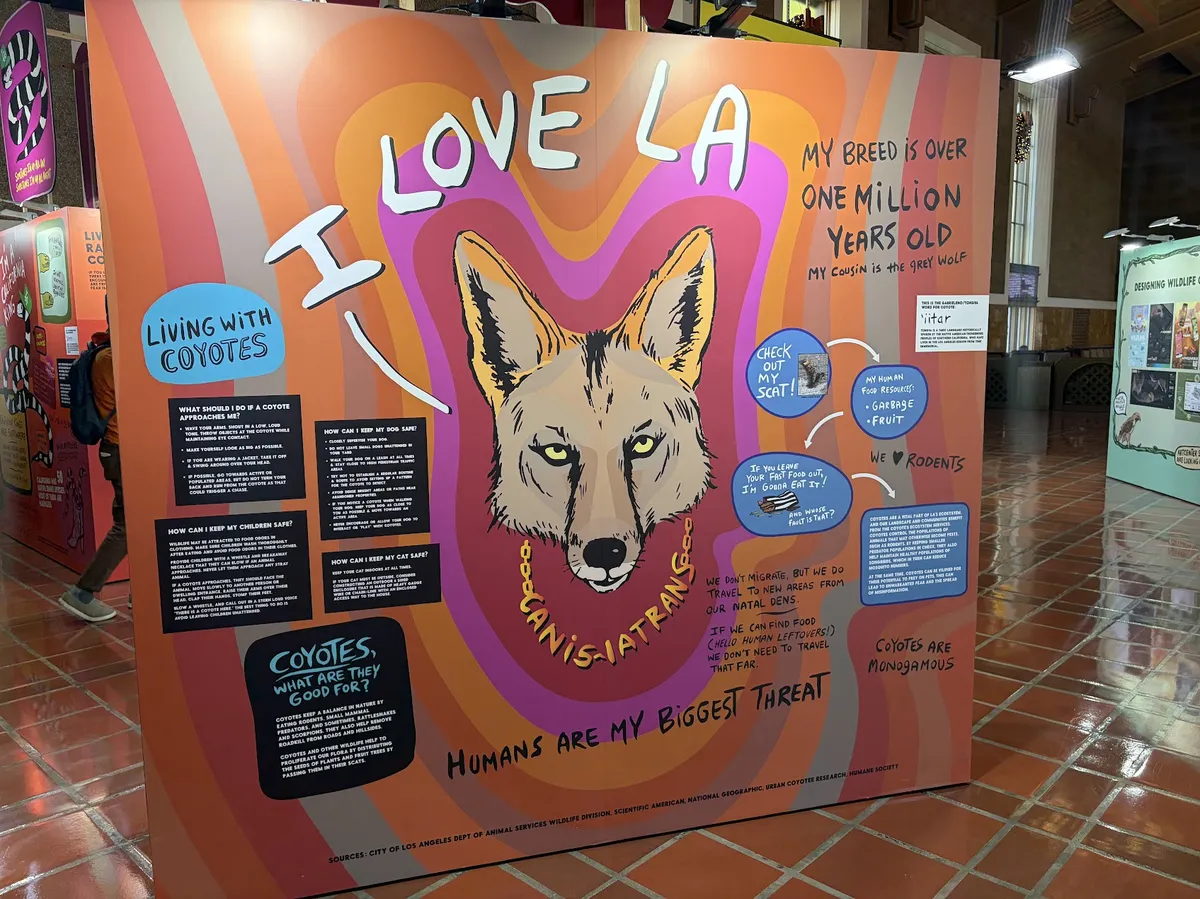
Union Station currently has a small exhibit about the kinds of cool or exciting or dangerous wild animals you are likely to see in LA. This seems like an attempt at educating the public about animals that have negative reputations. It covers snakes, coyotes, and mountain lions, and it features an enormous map about those animals (plus red-tailed hawks, which are simply cool) being sighted all over Los Angeles on iNaturalist:
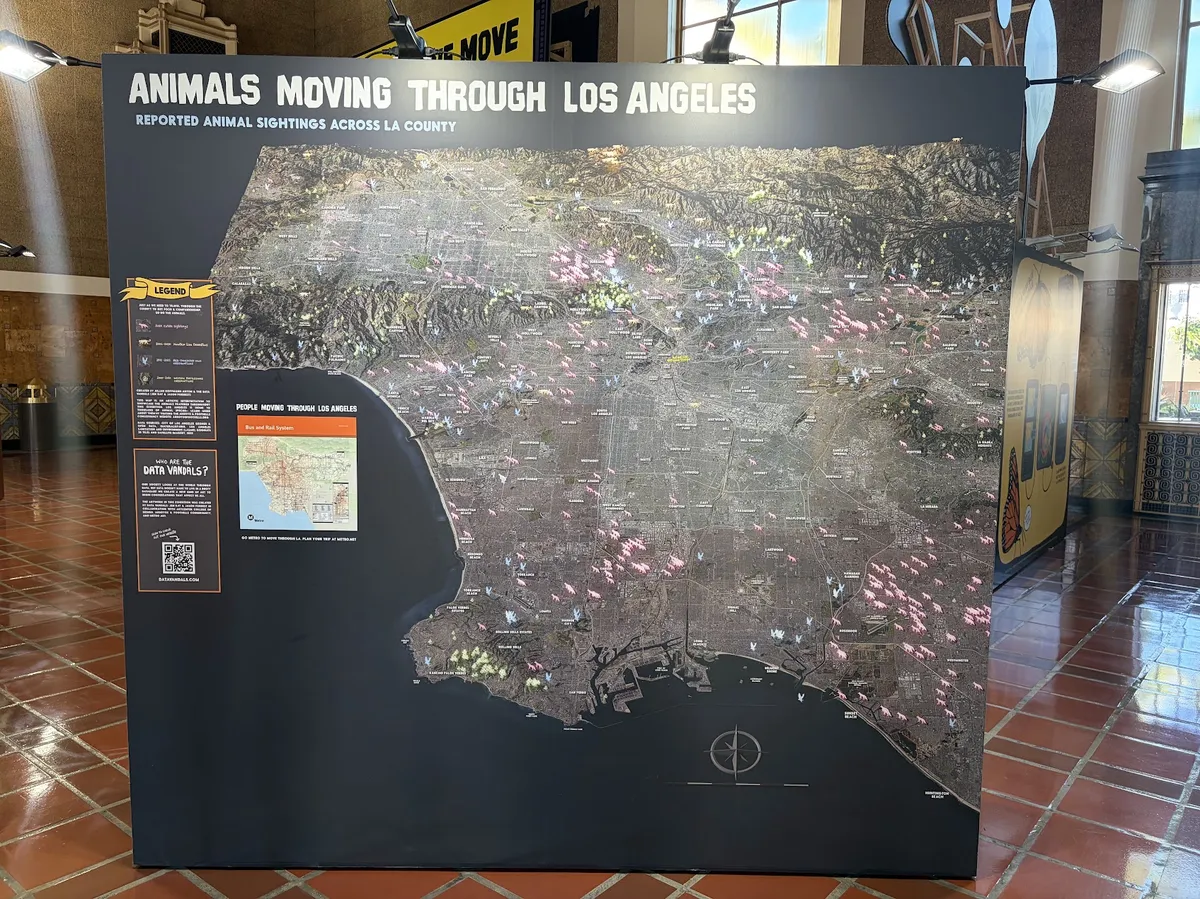
The graphic design on the exhibit is a lot of fun.
Anyway, I was surprised and excited to see public art about iNaturalist data during this period of time when I've been particularly into submitting iNaturalist observations. (I am trying to do one every single day, at the minimum.) Unfortunately, none of my data made it into the big map. I have red-tailed hawk observations from the time periods they drew data from, but the map shows red-shouldered hawk observations, for some reason. Oh well!
I keep using iNaturalist because it is fun and interesting all on its own... but my iNaturalist "year in review" summary says that only one of my observations from 2025 was used by any research or educational institution. I have grown to not ever expect the things I'm finding to show up in any research at all. It's all too common and ordinary. But it was fun to see that at least someone out there is using very mundane observations, like coyote photographs, to create some kind of public educational material.
Anyway, here's the organization that made the installation. There are little bits of imagery there of some of the other data visualization art installations they've done in other cities. Seems like cool work!